2020-21 ~2 years
UX, UI, Research, Leadership
Big data now allows researchers to speed up discoveries, by analysing existing patient data. In practise, researchers have a hard time accessing that data. They don’t know what is out there, there’s no easy way or central place for data holders to advertise their datasets, and strict data protection rules slow everything down. I was asked to create a portal where researchers could search for the data and resources they need, with a streamlined application process. I was the Design Lead, managing 2 designers. I did the UX and UI for the features you see here. I also ran qualitative user research.
Adapting to their existing behaviour
After speaking with users we realised that researchers don’t have a linear process for finding the data or tools they need. What they need is too specific, so they can't just search "dataset x". Instead they may see a similar paper, check out the authors, what datasets they used, following a breadcrumb trail to find any potentially useful resources. We adapted to this existing behaviour, linking and clearly signposting any relationship between entries - using the same existing habits, only faster.
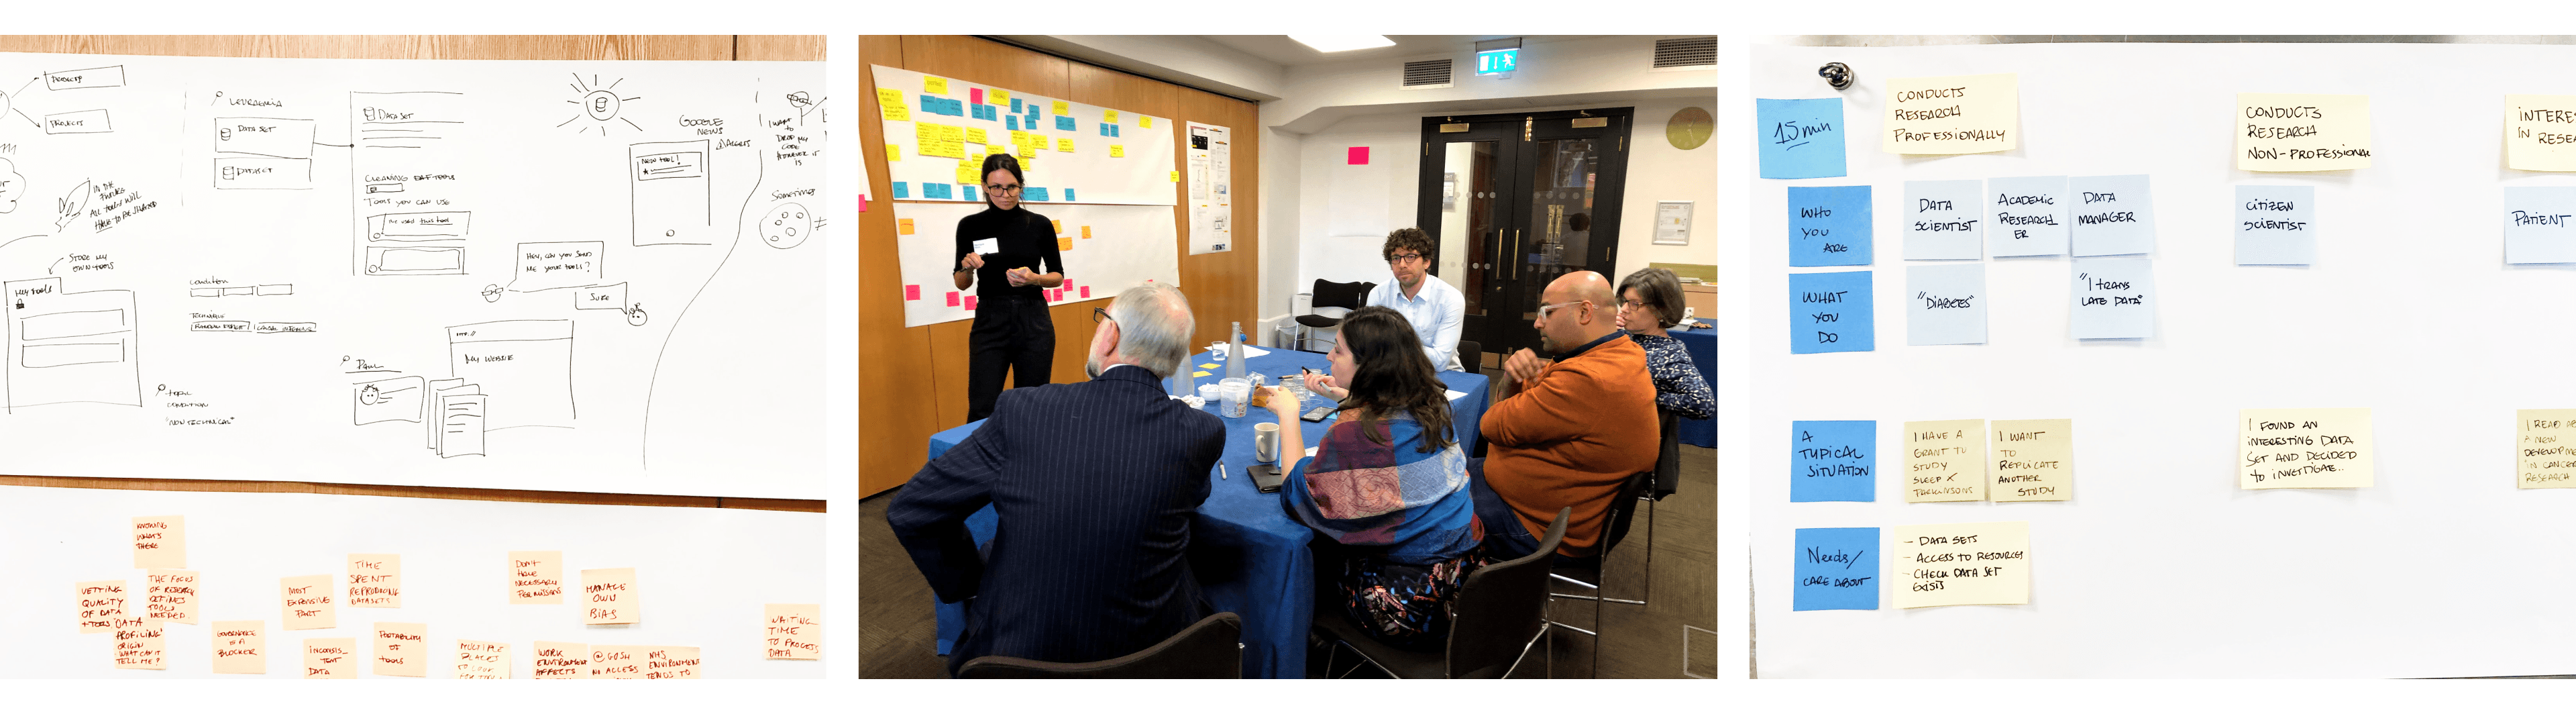
Mapping the ideal experience
We worked in tandem with development, in fast-paced Lean and Agile sprints to get features out in front of users as quickly as possible. In parallel, I also led a service design workstream to map the ideal end-to-end journey (both on and off-line), which provided a north-star for the product team. We spoke to users early and often, through workshops and usability testing.
For each feature we collected requirements and mapped the main journeys in collaboration with stakeholders and, when available, users and even developers. This made sure everyone was on the same page from the start and turnover was quick thereafter, sometimes features would go into development in only a couple of sprints.
Working with growing content
We had varying levels of information about each dataset, some with lots of detail, and some with less. We made sure nothing looked “empty” - if we had extra information then great, but it should still look complete with just the basics. You can see this in Technical Details (above), where the columns with additional data are highlighted with stars, rather than an empty state saying “no table data to show here”.
A collaborative application process
The application process to request data is an incredibly complex undertaking, sometimes taking months and several revisions. We worked on making the form itself simpler, but also building in collaboration features, such as the ability to ask questions (what does this question mean?), invite collaborators, and request revisions for specific questions. This was inspired by the way we saw researchers and reviewers using comments in the Word document for the applications.
So what happened?
A year after launch the Gateway now has over 700 datasets, 2,000 registered users and 500 data request applications. The portal was also used to accelerate access to COVID-19 datasets as part of the government’s National Core Studies.